Cohort Analysis for Credit Consumption in Activation Funnels
Credit-based products need activation redefined as actual consumption, not just login behavior.

Standard cohort analysis groups customers by the month they signed up, then watches whether they stick around. That model works fine for subscription products where the value accumulates slowly, month after month, just by staying enrolled. It falls apart for AI and usage-based products, where a customer can sign up, log in repeatedly, and never once get the thing the product is actually supposed to do. Under a signup-based lens, that customer counts as retained. They stay retained right up until the day they cancel.
This is the gap that matters: an activation rate defined as "finished signup" or "came back within 7 days" says nothing about whether a single unit of work got done. It doesn't tell you if the user hit the moment the product was built to deliver, or extracted the outcome they were paying for. Lenny's Newsletter ran an activation survey in October 2022 with more than 500 responses, and the SaaS median and average activation rates it found are in a low-to-mid range. But those numbers describe a behavioral milestone, a click, a screen viewed, a checklist finished, not a unit of consumption. They come out of products where the activation event is a UI action. Nobody drew a credit to get there.
Credit-based AI products need a different definition entirely. The activation event is the first time the meter actually moves: a batch of tokens processed, a generation finished, or a workflow run start to finish. Skip that redefinition and a team can stare at a cohort chart that looks perfectly healthy, retention holding steady quarter over quarter, while dormant accounts that never made a single API call pack the funnel. The chart is technically accurate. It's just answering a question nobody should be asking anymore.
What credit consumption reveals that login-based signals cannot
Ask a different question than "did the user log in?" Ask instead: did the product do anything? That's the real test credit consumption applies, and it's binary in a way login data can never be. There's no equivalent, in credit terms, of "browsed but didn't buy" that still gets marked as an active session. Either the meter moved or it didn't.
Three signals fall out of that binary test, and none of them are visible in login data. Speed to first real use measures the days between signup and the first credit draw, not the first login, which is a softer and far less honest number. Consumption depth is one of three things credit consumption reveals that login data cannot. Consumption pattern tracks the shape of that usage over time: growing, flat, or front-loaded and then dead silent, each shape pointing toward a different retention curve.
This is the behavioral cohort principle, and it replaces signup date as the organizing variable entirely: group users by what they did, not when they showed up. Users who consumed their first credit quickly, after several days, or never will show sharply different Day-30 retention curves. The 2026 Userflow and OnRamp data backs this up directly: split cohorts at the activation event and report two lines, activated and not-activated, at Day 7, Day 30, and Day 90. For credit products, "activated" has one honest definition: consumed at least one meaningful credit event.
Compare the median time-to-second-session for users who activated against those who dropped off, a method from Gatilab's S4 framework originally built around session behavior. For a credit product, the equivalent comparison isn't about sessions at all, it's about the behavior that activated users completed and dropped users never did, and that behavior is almost always a consumption event rather than a click somewhere in the UI.
Defining the Credit Consumption Activation Event
Try writing your product's activation event in one sentence, with a number attached. If it comes out vague, that vagueness is the problem, not a detail to fix later. A workable version reads something like: the user generated at least one output consuming more than some threshold number of credits within the first 7 days. Anything softer than that isn't an activation event, it's a hope.
Getting to that sentence takes four steps, and none of them are optional.
Start by pulling 6 to 12 months of historical retention data and looking for the consumption behavior that cleanly splits churned users from retained ones. The split itself is the signal. It is not a hypothesis some product manager wrote on a whiteboard.
From there, test specific candidate events against what actually happened to retention. A single credit draw of any kind is usually too weak a signal, since one accidental API call doesn't predict much of anything. Completing a meaningful workflow for the first time is a stronger candidate, though it still needs to be checked against the retained cohort before anyone trusts it. Reaching a consumption threshold that corresponds to a "real" outcome, such as a first successful generation or a first completed agent run, is typically the strongest predictor. Slack's own activation event was found this same way, through cohort analysis rather than a guess: the team found a specific message-volume threshold, and users who crossed it retained at a far higher rate than those who didn't. A credit product has its own version of that threshold, a volume of credits or a workflow completed, and it gets found the same way, by looking at the data rather than arguing about it in a meeting.
Next, set a time boundary. An activation event that occurs after Day 14 doesn't predict retention the same way one from the first session does. The OnRamp 2026 report puts the aspirational target at first value delivered in under 14 days, which makes Day 7 and Day 14 the natural checkpoints to build around.
Finally, get the denominator right. Measure activation against completed signups, meaning accounts that actually cleared onboarding, not against every registration that ever hit the database. Counting every registration dilutes the rate with people who never engaged in the first place, and that dilution obscures the real number in noise. The common mistake here is defining activation as "invited a teammate" or "finished the setup wizard," actions that consume zero credits and predict close to nothing about product delivery.
Segmenting credit consumption cohorts across the activation funnel
Acquisition cohorts, grouped by signup month, are still the baseline. But for a credit product they only answer half a question on their own, and they need behavioral segments layered on top before they turn into something useful.
Picture a standard cohort table: signup month down the rows, months since signup across the columns, each cell showing a retention percentage. Now build a second version of that same table, except instead of "retained: yes/no," each cell shows credit volume consumed. That second table is where the real story lives.
Time-to-first-credit sorts users into buckets (same-session, Day 1–3, Day 4–7, Day 8–14, and never), and each bucket will show a different conversion rate. Credit velocity in the trial period separates users who burned through their allotment in one sitting from those who spread it across multiple sessions, and front-loaded usage is genuinely ambiguous on its own: it could mean a power user who found the product immediately, or a confused user mashing buttons trying to get something to work, and the two look identical until outcome data separates them. Credit type consumed matters for any product with more than one pricing dimension, tokens, GPU-minutes, API calls, agent steps, since which dimension a user reaches for first says something about who they are. Different consumption types tend to predict different long-term plans and different account values.
A second layer of segmentation compounds with all of that. Plan or tier at signup matters because conversion benchmarks shift sharply depending on trial mechanic: ChartMogul's 2026 study of 200 products found opt-in free trials and credit-card-required trials converting at meaningfully different rates. Acquisition channel matters too. Any channel producing a flood of signups paired with low credit consumption is quietly wasting acquisition spend. Use-case or persona, where it's captured at signup, adds a final layer, since the consumption pattern that predicts retention for a developer hitting an API looks nothing like the pattern for a business user working through a wrapper product.
Always report cohort retention as two parallel lines, activated and not-activated, as the Userflow and OnRamp 2026 benchmarks specify, because blending them together makes both lines meaningless, and this split overrides the rest.
Once the table exists, its shape starts talking. A sharp drop from Month 0 to Month 2 usually points to weak activation, slow time-to-first-credit, or a mismatch between what users signed up for and what the product can currently deliver. A cliff specifically at Month 12 tends to trace back to annual renewal friction, a price increase landing badly, or customers who simply can't forecast next month's bill and bail rather than risk it, a particular hazard for credit products. A cohort that goes flat or keeps expanding after Month 3 has usually found a workflow worth repeating, and expansion revenue often starts appearing there.
Reading consumption patterns that predict conversion and long-term retention
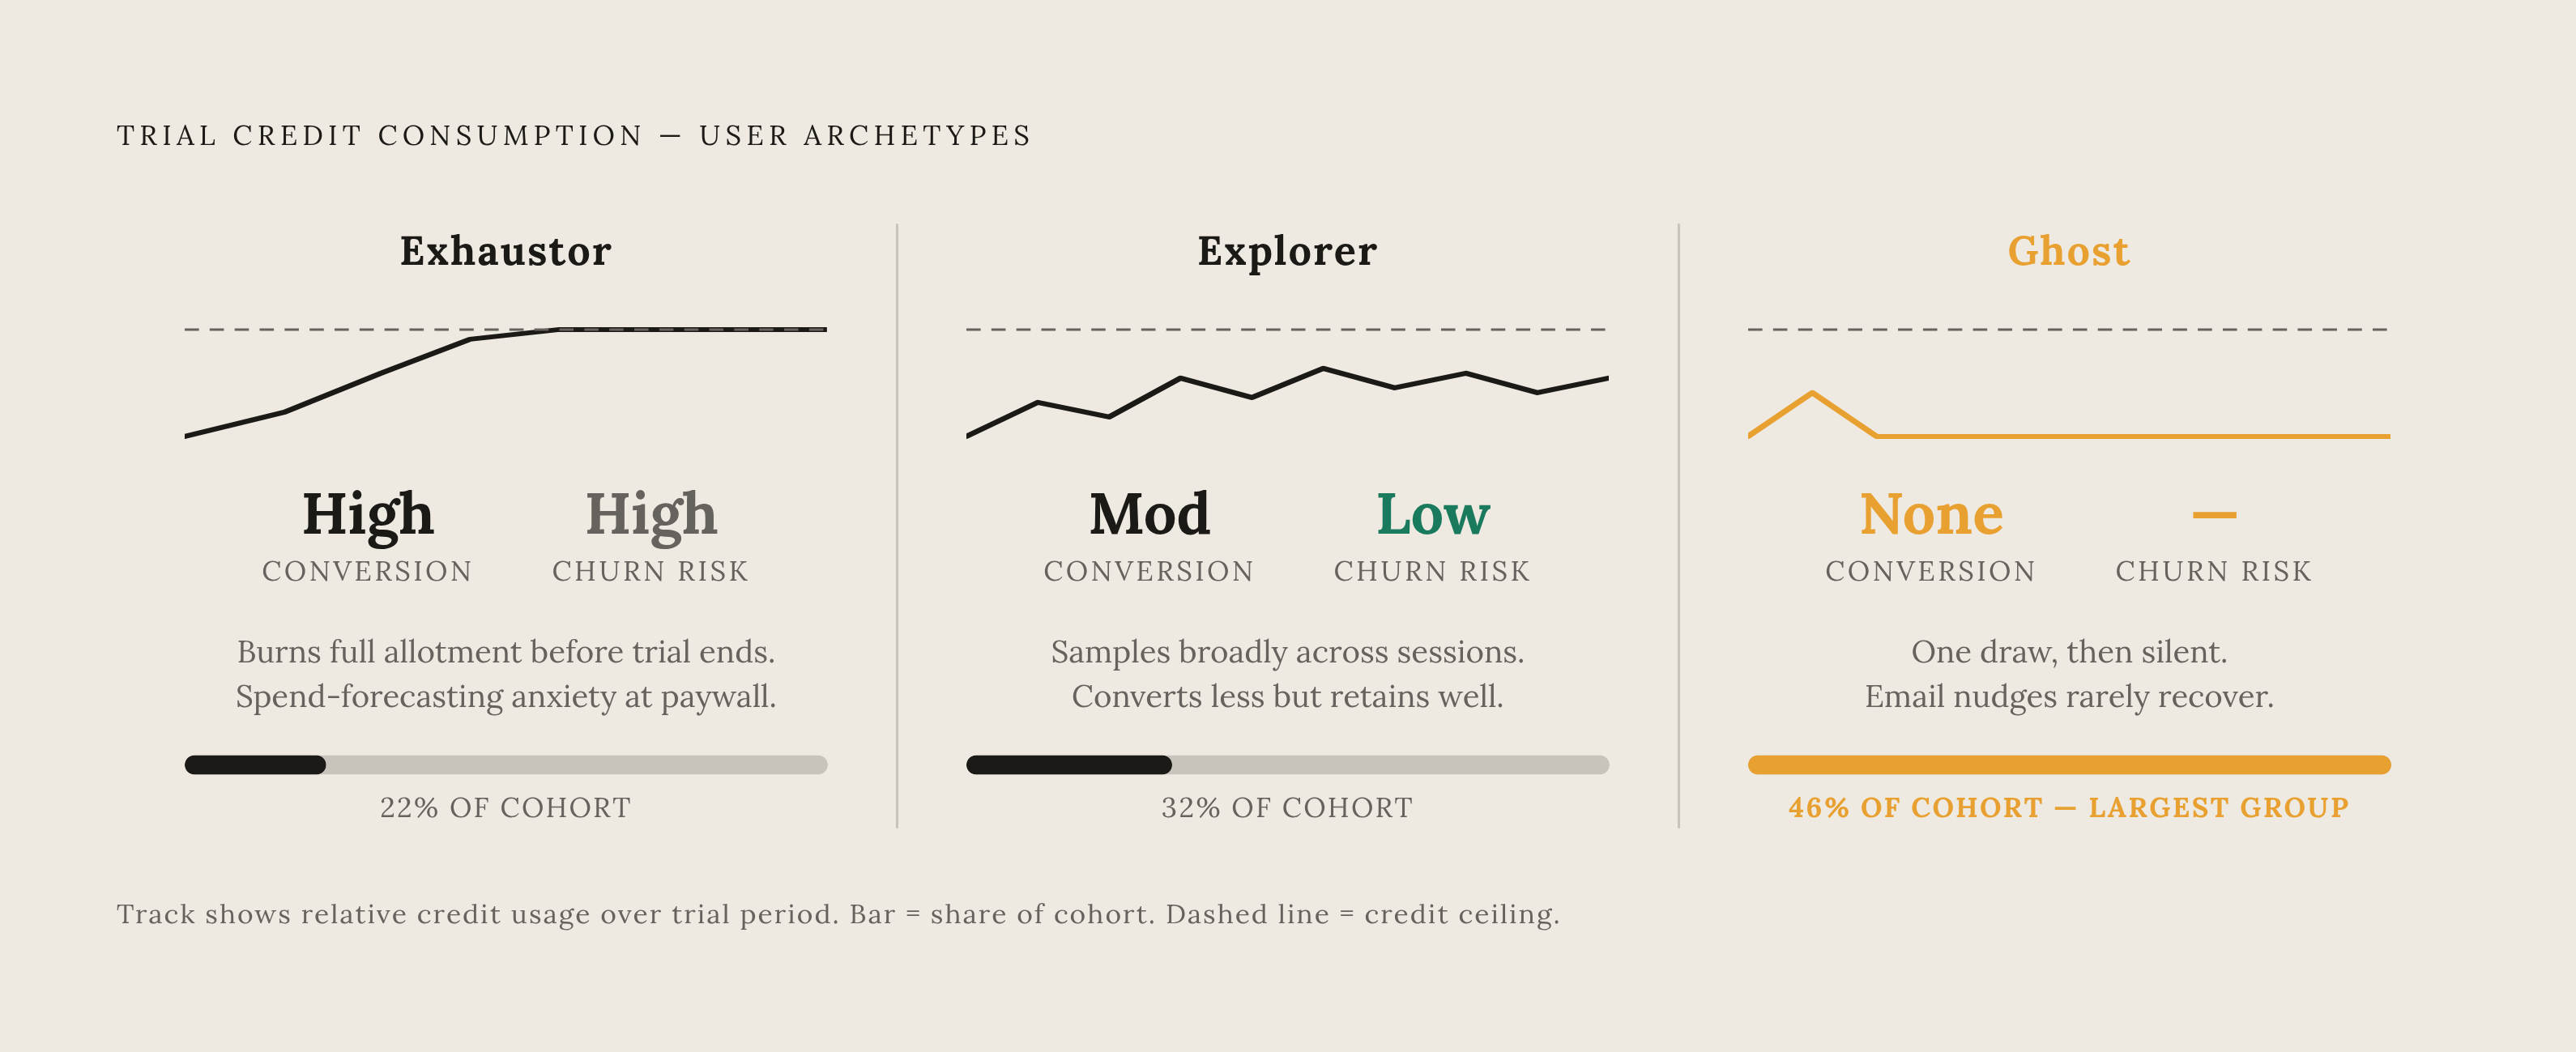
Once the cohort table is built, three consumption archetypes tend to appear inside it, and each one calls for a different response.
The Exhaustor burns through the entire trial credit ceiling before the trial period ends. That's a strong intent signal, but it carries risk: if the conversion step introduces any spend-forecasting anxiety, this user churns right at the moment they were closest to buying. What they need at that moment is visibility into spend and overage rules they can actually predict, not a surprise invoice.
The Explorer spreads credit use across multiple sessions and rarely, if ever, exhausts the trial allotment. This user converts at a lower rate, but once converted, tends to churn less in the early months, a genuinely durable customer whose evaluation just took longer. Time-to-value is slower here, but slower isn't the same as weaker.
The Ghost signs up, maybe fires off one credit draw out of curiosity, and then disappears entirely. In most credit-based trial cohorts, this is the largest group by far, and email nudges rarely bring them back, because they never reached anything resembling an aha moment in the first place.
The relationship between these archetypes and eventual conversion is direct: consumption depth during the trial window is a leading indicator of who pays, and users who cross a meaningful consumption threshold convert at rates that dwarf the users who barely touch their credits. That threshold varies by product across the industry. It's specific to each product, and it's found through the same cohort analysis laid out earlier in this piece.
Industry benchmarks serve as context, not as a target to chase blindly. ChartMogul's study of 200 products puts good free-to-paid conversion at 6 to 8 percent and great at 15 to 20 percent. Pulseahead's analysis of that same data found the distribution is bimodal: products tend to land either in the low single digits or above 15 percent, with very few in the middle. Vertical matters almost as much as trial structure here. First Page Sage's 2025 research, cited by Pulseahead, found enterprise and fintech products converting at meaningfully lower rates than CRM and education tools.
Timing deserves particular attention. Pulseahead's read of the ChartMogul data shows most B2B conversions happening right as the trial expires, with conversion rates dropping sharply after Day 7 and falling to roughly 1 percent by Day 14. That means whatever consumption pattern appears in the first week is doing almost all the predictive work, and anything after that is mostly noise.
Logo retention answers whether users stay, revenue expansion answers whether they grow, and those are not the same question. A user who stays subscribed but quietly consumes fewer credits every month is retained by the logo count and a slow-motion problem by the revenue count. The cohort table needs to track credit volume over time, not just an active or inactive flag, or it will miss this.
How trial credit structure shapes what the cohort data can tell you
Everything above assumes the cohort data is telling the truth. It doesn't always.
When every trial user gets the same flat credit budget, the cohort data conflates users who found value and wanted more with users who consumed carelessly and ran out, and the Exhaustor archetype cannot be disaggregated without knowing whether they hit a ceiling or a natural stopping point.
Windsurf's now-retired credit model is a clean illustration of what goes wrong. The company found that charging the same flat rate for both simple and complex requests left users afraid to ask quick questions, and pushed them toward cramming several requests into a single prompt just to get more value per credit. That's pricing anxiety dressed up as behavior, not a product-value signal in the cohort data. It's pricing anxiety dressed up as behavior, and it makes the consumption numbers unreadable as evidence of anything real. Anyone reading a cohort table needs to know the pricing structure behind it before drawing conclusions from the shape of the data, because the structure itself can manufacture the pattern.
The fix, where it's available, is designing trial credits to map closely onto the production pricing model, same dimensions, same granularity, so that behavior inside the trial actually predicts behavior after conversion. Trial credits built as a simplified abstraction of the real pricing model tend to break down exactly at the conversion point, when the abstraction disappears and the real meter takes over.
Live examples show just how much this structure varies across products already on the market. Salesforce's Agentforce launched in October 2024 with per-conversation pricing, moved to a per-action credit model in May 2025, then added per-user licenses in June 2025, three separate pricing epochs, each one producing a cohort structure that has to be read on its own terms. Atlassian bundles a set number of Rovo AI credits into its standard plans per user per month, then charges separately for conversations beyond that limit, a structure where cohort analysis has to separate included usage from paid overage or the numbers blur together. GitHub Copilot moved to token-based AI Credits effective June 1, 2026, a mid-stream model change that forces a cohort split right at the transition date, since consumption measured before and after that date isn't measured in comparable units.
The same pattern connects all three examples. When a vendor moves AI features from an add-on into a bundle, or from unbounded use into a credit-limited one, the existing cohorts effectively reset, and migration usually happens quietly at renewal. The continuity looks intact. It isn't, and trusting it anyway is how a team ends up making decisions off a chart that's technically accurate and substantively wrong.